
In late October, I spoke at Australia’s largest SAP EAM conference for the fourth time. Each time I present, I’ve made a habit of asking certain questions to the audience and to people in attendance afterward. It never fails to surprise me how little most businesses are taking advantage of some of the simplest, most powerful and valuable parts of SAP, especially within the PM module.
I’d like to take this opportunity to write about some simple things you can do to dramatically improve the way you use the system to record information and to show you how you can report on this.
If there’s one thing you take away from these entries, (and I hope this is completely obvious) let it be this: “If we don’t record it, we can’t report on it."
Now, you might be saying, “But I have [ERP System], it records EVERYTHING” and that might very well be correct, but the common issue here is not what is being recorded, but how it’s being recorded. All ERP systems are simply databases, and if there is one thing databases are good at, it’s reporting. The key here is inputting the data into your system in a way that allows your system to build accurate reports.
Side note - I bet you’ve heard this saying before: “Bad data in, bad data out” (In most cases it contains much more vulgar terms…) This isn’t new for most, but it is fundamental to everything we will be talking about. But if you’re worried, or convinced that bad data is inevitable (It usually is), I’m going to explain why “Bad data in” can still be useful. But you’ll have to return for part two to see why.
So let’s start off by diving into one of my favorite SAP scenarios, and one of the things I ask people about when on site and at various conferences:
Reporting on Time Wasted
Time and time again, I see businesses attempting to report on time wasted by maintenance personnel on site, whether it be waiting for parts, permits, operations, or something else, as this wasted time equates to wasted money. Some people will buy software promising to provide these figures, some will spend thousands, or even millions conducting field studies to find process improvements, others will ask their IT departments to build BI/BW reports to do the same. However, 9 times out of 10, the amount of time being wasted isn’t even being specifically (and consistently) reported in the first place, and no amount of report builders, LEAN/Six-Sigma experts, or software packages is going to be able to trawl through long text, pieces of paper and employee’s memory to find these numbers.
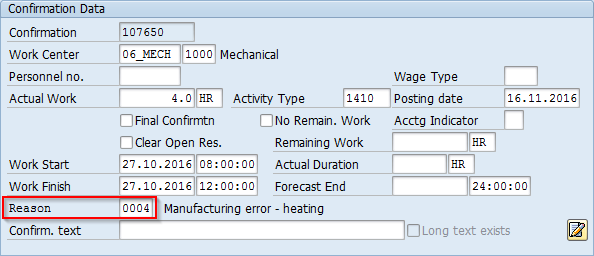
Did you know that there is a standard SAP field that can be used during time confirmations (through both IW41 & CATS) to specify from a pre-defined list, what they spent time doing? We’ve found that most people don’t. It’s the “Reason” field, and a business can define any amount of codes that can be used to capture specific time against an operation.
Typical reasons used might be:
- Waiting for Materials
- Waiting for Permits
- Waiting for Equipment Availability
- Delayed due to environment
- Etc.
Without using these codes, the only way a user can tell the system what they spent their time doing is to either record these delays in the long text/some other source (Text fields cannot be easily reported on)
or
Confirm the entire amount of time spent on the operation in one go.
While it is the most common method, reporting the time spent in one entry causes two problems:
- We now can’t easily tell how much of that 8-hour confirmation was time wasted and;
- Now SAP assumes that the work actually took 8-hours, so when someone is reviewing completed work to update task lists and improve planning accuracy, the system will tell them that a typical 6-hour job now takes 8 hours.
These discrepancies might sound small, but they add up over time and have a huge impact on yearly maintenance budgets, yet could be reported on and managed with simple changes to a system and the business process.
Now, in the real world, most users only really care about proving that they weren’t sitting around all day (or in some cases, hiding the fact that they do!) so if we don’t give them a simple way to do this easily, they won’t do it, and for a long time I suspected that this was the root cause of the Reason field not being used. However, my very unscientific market research has shown that most maintenance departments simply didn’t know that this field existed or how it could be used.
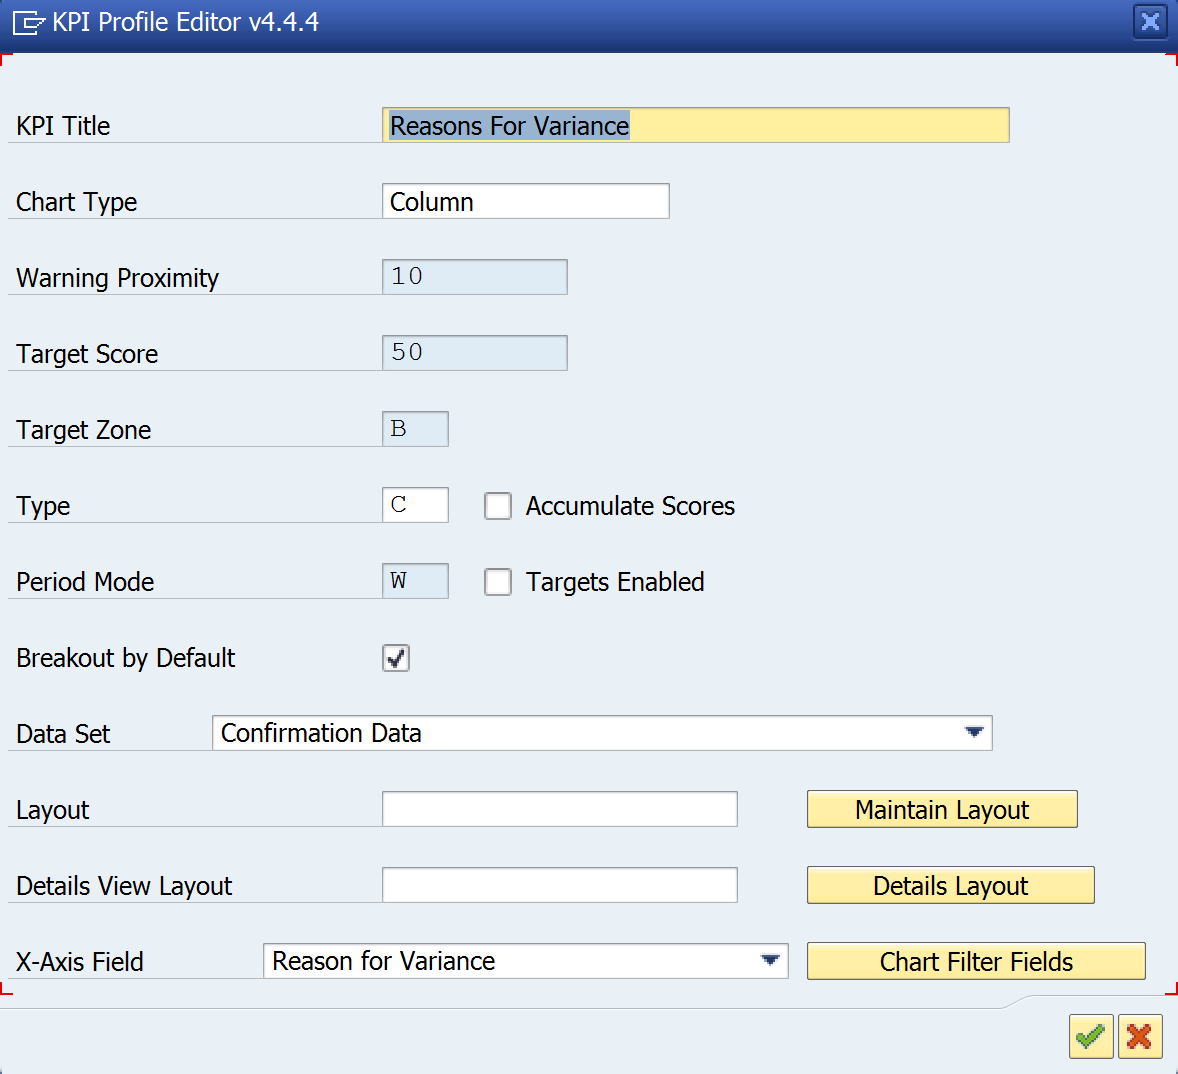
For those of you lucky enough to have the Prometheus Reporting and Analytics solution, setting up a report for these is as simple as creating a profile that contains a chart with the following settings:
Once you have created this profile, simply load data from a scheduled snapshot (if you don't have an automatic one, you could take one manually) and you will see a chart that summarizes your time confirmed hours.
With Prometheus KPIs, you can configure the chart in a few different ways depending on your preference.
Here are two examples:
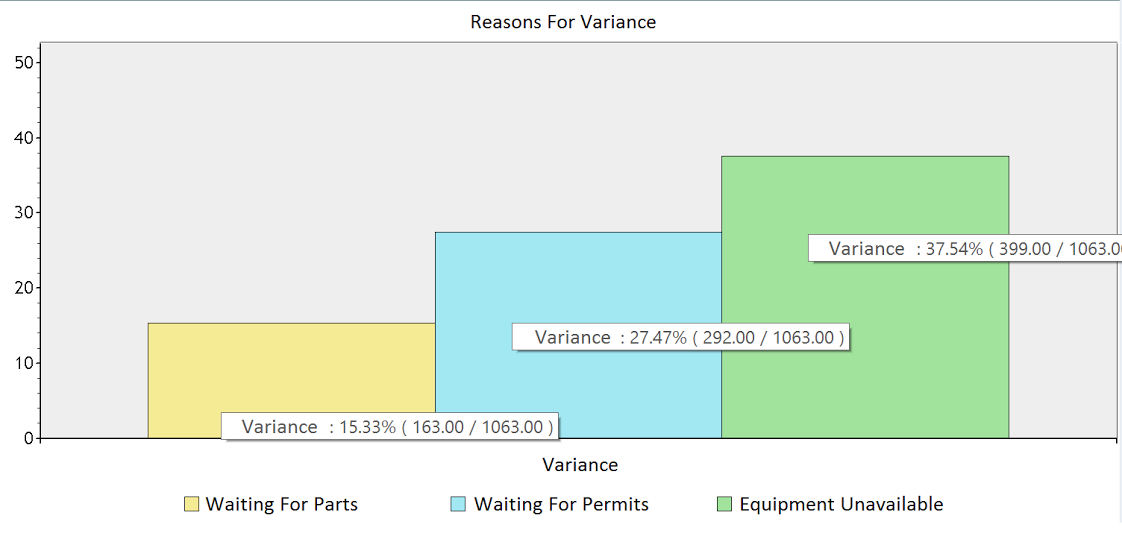
This chart design is displaying the data as a percentage of variance for those who want to focus on where we are deviating from the plan most.
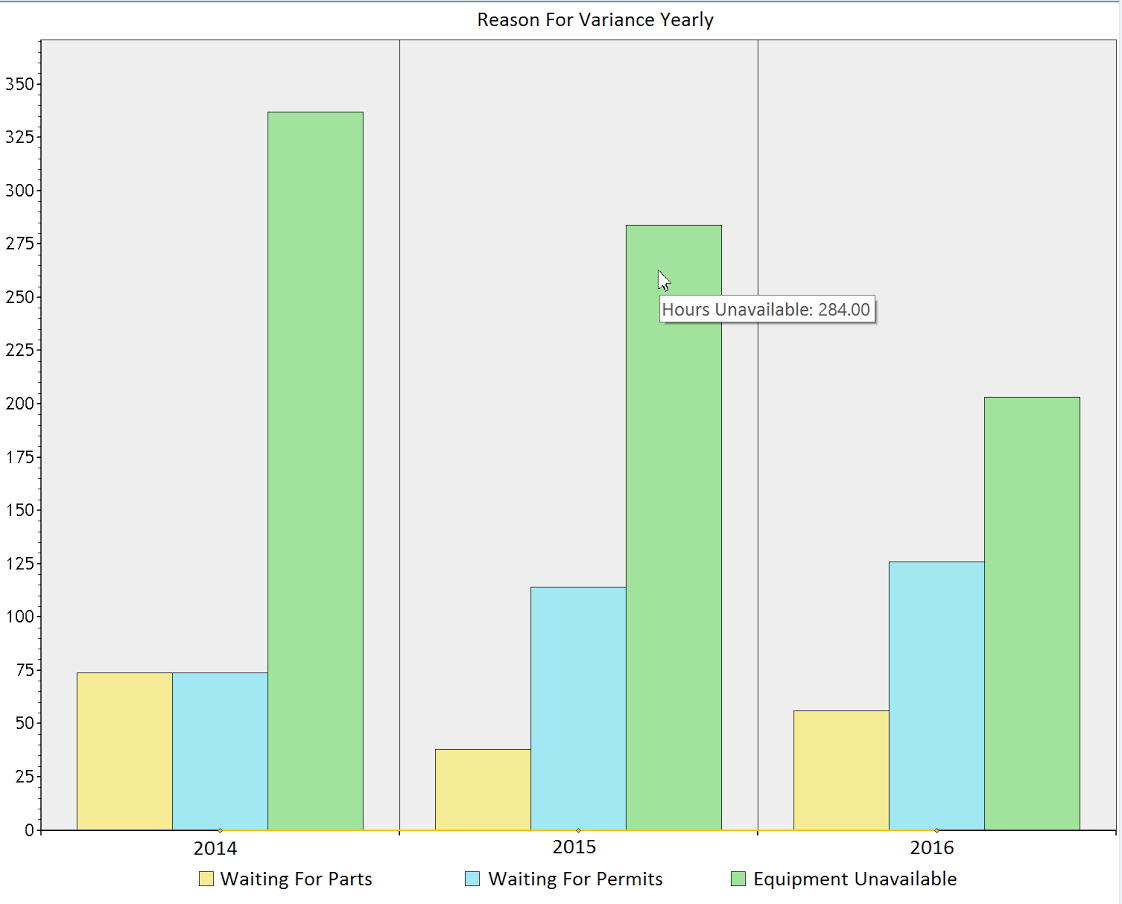
This example is much simpler and just shows a total sum of hours for each "Reason" code for each year, but this can be dynamically changed to monthly, weekly, or even daily.
While both charts look fairly different, they are both incredibly simple to create, and the layout can be changed on the fly or locked down and pre-defined for specific users if you so desire.
Stay tuned for part two where we will dive deeper into some other common asset management reporting flaws and what we can do about them. Learn more about Prometheus Reporting & Analytics solutions.
Last Updated: December 11, 2024