In project management and business growth, tracking progress and making informed strategic decisions is critical to achieving success. Organizations must rely on tools that provide clear, data-driven insights into performance, resource allocation, and future trends. One such essential tool is the S-curve—a graphical representation that maps cumulative progress over time, revealing distinct growth phases and potential inflection points.
The S-curve serves as a fundamental component of project reporting, analytics, and forecasting. It helps managers assess whether a project is on track, identify deviations early, and anticipate resource needs as the project progresses through its lifecycle. For businesses, the S-curve provides a framework to understand expansion patterns, recognize stagnation risks, and plan for long-term sustainability.
This article takes an in-depth look at the S-curve, exploring its significance in both project management and business strategy. We’ll break down its principles, applications, and practical steps for effective implementation. Whether you're looking to improve project tracking, optimize decision-making, or better understand business growth dynamics, this guide will provide valuable insights to enhance your approach.
Key Takeaways
-
Realistic Progress Tracking: The S-curve accurately reflects the natural, non-linear progression of projects, with phases of slow initiation, rapid acceleration, and eventual maturity.
-
Improved Forecasting and Analysis: It enables managers to forecast future performance, identify variances between planned and actual progress, and make informed decisions to keep projects on track.
-
Strategic Business Insights: For businesses, the S-curve helps identify growth stalls and strategic inflection points, signaling when to innovate or pivot to maintain long-term momentum.
-
Effective Resource Management: By visualizing the entire project lifecycle, the S-curve allows for better resource allocation, ensuring that teams have what they need during periods of rapid growth and helping to optimize costs as a project matures.
What is an S-curve?
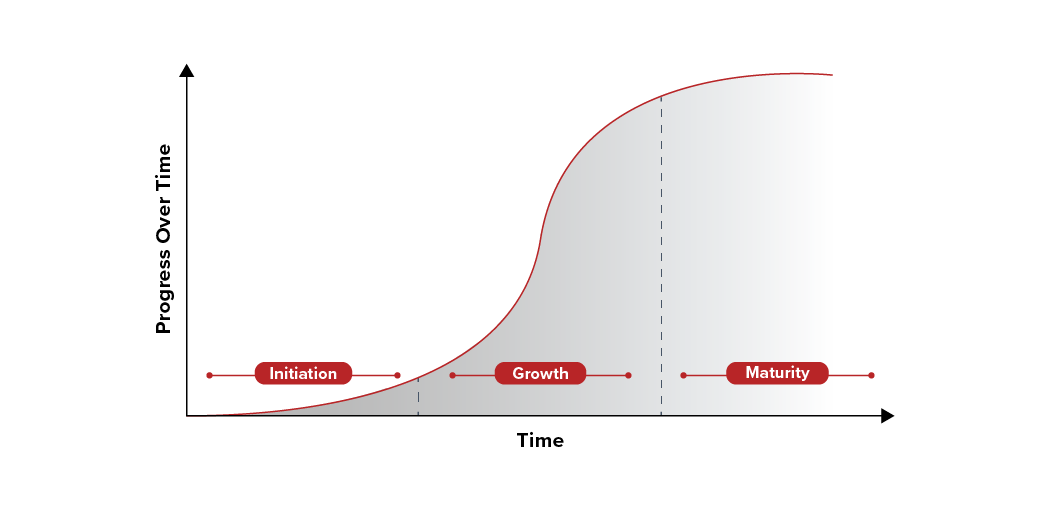
An S-curve is a graphical representation of progress over time, following an "S" shape. It reflects a natural project or business cycle—from slow beginnings to rapid growth and eventual stabilization.
What does an S-curve indicate?
In the early phase of any project, progress may be gradual as teams mobilize resources and strategies are implemented. As momentum builds, progress accelerates rapidly, marking the middle phase of the curve. Finally, as the project approaches its end or a business nears market saturation, growth stabilizes, and the curve flattens.
The S-curve illustrates:
- Initiation and ramp-up: Slow progress during planning and mobilization
- Acceleration: Rapid growth as resources are deployed effectively
- Maturity: Stabilization as completion nears or market saturation is reached
Understanding these phases helps managers predict challenges, allocate resources effectively, and adjust strategies.
What is the S-Curve principle?
Unlike linear progress, the S-curve acknowledges non-linear development, with exponential rather than steady change. This principle is based on the observation that most projects and business processes have an initial lag phase, followed by a period of rapid development, and finally a deceleration as they reach their limits. The S-curve principle is useful for:
- Forecasting: Estimating future progress based on trends
- Performance analysis: Identifying underperformance or exceeding expectations
- Resource allocation: Determining when to ramp up efforts or redistribute resources
This non-linear understanding can help leaders avoid misinterpretations that might arise from expecting constant progress throughout a project’s life.
What are the four stages of the S-Curve
Breaking the S-curve into distinct stages can offer deeper insights into the project or business cycle. Although different industries may define stages slightly differently, a common breakdown includes:
- Initiation: Planning, resource deployment, and overcoming early hurdles
- Growth: Rapid progress as strategies take effect
- Maturity: Stabilization, market saturation, or nearing completion
- Decline/transformation (optional): Possible obsolescence or strategy renewal
Recognizing these stages ensures effective project and business management.
S-Curve in reporting and analytics
Reporting and analytics are integral to modern project management. By integrating the S-curve into your reporting framework, you can visualize progress, forecast future performance, and identify potential bottlenecks before they become critical issues.
For example, when monitoring the progress of a capital project, an S-curve can help illustrate whether the project is on track with its budget and timeline. Discrepancies between the planned and actual progress can be quickly identified, allowing managers to take corrective actions. The S-curve not only supports data visualization but also aids in performance benchmarking, ensuring that decisions are based on objective trends rather than subjective estimates.
Integrating S-curves into your reporting system can be achieved through specialized software or project management tools. Many platforms, such as Prometheus Group’s Reporting & Analytics Solutions, allow you to incorporate S-curve graphs directly into dashboards. This integration offers a real-time look at project progress and helps maintain alignment with overall strategic objectives.
Creating and analyzing S-curves
The true value of the S-curve lies in its creation and subsequent analysis. Let’s walk through how you can build an S-curve and what data points are essential for a meaningful analysis.
How to create an S-curve
Creating an S-curve begins with data collection. The data should reflect cumulative progress over time—whether it’s the percentage of work completed, budget spent, or units produced. Here are some steps to create an effective S-curve:
- Define key metrics: Identify metrics such as cost, labor hours, or revenue.
- Collect data: Gather historical and current project data.
- Plot the data: Use software to visualize cumulative progress.
- Analyze the curve: Observe growth trends and adjust models as needed.
- Validate the model: Update the curve with real-time data for accuracy.
Using data for S-curve analysis
Reliable data is the foundation of meaningful S-curve analysis. Without accurate and up-to-date information, the insights drawn from an S-curve could lead to flawed decision-making. When properly utilized, the S-curve helps project managers and analysts extract valuable insights that shape future strategies.
- Trend analysis: Identify deviations from expected growth
- Variance identification: Spot overperformance or underperformance
- Forecasting: Predict future progress based on the curve
- Scenario planning: Model potential changes and their impacts
S-curves vs. linear progress tracking
Many organizations default to linear progress tracking, assuming that projects and growth follow a predictable, steady trajectory. However, most real-world initiatives experience phases of slow buildup, rapid acceleration, and eventual stabilization—something a simple linear model fails to capture.
S-curves offer a realistic project progression model, unlike linear tracking, which assumes steady growth. Benefits include:
- Realistic modeling: Captures acceleration and deceleration phases
- Early warning signals: Detects potential issues early
- Strategic decision-making: Informs resource reallocation and timeline adjustments
S-curve in business growth
While S-curves are widely used in project tracking, their applications extend far beyond managing deadlines and resources. In business growth, they serve as a roadmap for understanding market penetration, operational scaling, and product life cycles, helping companies anticipate when to innovate or pivot.
Navigating growth stalls
Every business experiences periods of stagnation. These stalls, while sometimes inevitable, can often be mitigated or even turned into opportunities. The S-curve provides a framework to identify when a business is entering a plateau phase. Once identified, managers can investigate underlying causes, such as market saturation or internal inefficiencies, and implement strategies to rejuvenate growth.
Strategic inflection points
Inflection points are moments when the trajectory of growth changes dramatically, either accelerating into rapid expansion or slowing down significantly. Recognizing these points is critical for business strategists. An S-curve can highlight these inflection points early in the cycle, enabling proactive decision-making.
Keeping the S-curve going
Sustaining growth requires constant adaptation. To maintain momentum beyond the initial S-curve cycle, businesses should:
- Innovate continuously: Update products and services to stay competitive
- Diversify offerings: Expand into new markets or segments
- Leverage technology: Use data analytics for efficiency and growth
By understanding the lifecycle of the S-curve, businesses can set realistic expectations and continuously adjust strategies to maintain momentum.
Harnessing the S-curve for smarter decision-making
The S-curve is a powerful tool that bridges raw data and strategic decision-making. It provides project managers with a clear view of progress, helping them allocate resources effectively and address potential roadblocks before they escalate. By tracking planned versus actual performance, managers can make informed adjustments that keep projects on course.
For businesses, the S-curve offers a framework for recognizing growth stages and identifying key inflection points. This allows leaders to anticipate market shifts, optimize strategies, and sustain long-term success. Understanding where a project or business falls on the curve helps maximize opportunities and mitigate risks.
By integrating S-curve analysis into project and business strategies, organizations can enhance forecasting, improve resource management, and make data-driven decisions that drive sustained growth and efficiency.
How Prometheus Group can help
To effectively integrate S-curve analysis into your organization’s project management practices, consider leveraging Prometheus Group’s advanced solutions. From capital project tracking to strategic business planning, these tools ensure that your projects stay on course and align with overarching business objectives. Our suite of project management and analytics solutions empowers organizations to streamline processes, enhance reporting, and drive data-driven success.
Get in touch with Prometheus Group today to learn how our solutions can help your business stay ahead of the curve.
See the Prometheus Platform in Action
Discover how you can streamline your asset management processes and maximize your ROI.
.jpeg?length=360&name=5f6fab01f3bafb23b047d67c_DATA_SHEET_Maxavera_Integrate_Oracle_eAM_with_Primavera_P6_30%20(1).jpeg)