
On the journey towards maintenance excellence, conventional wisdom places a heavy emphasis on the efficient planning, scheduling, and execution of work. We are told to “maximize resource utilization” and work as efficiently as possible to “keep the backlog under control.” But have you ever taken a step back to ask: why are we even doing these maintenance tasks in the first place? Are the inspections that we carry out every month actually a good use of resources? You can be as efficient as you want in executing maintenance – but if you are doing the wrong maintenance, then you are still wasting your time.
What matters more is that you design an effective Maintenance Strategy – i.e. a program of maintenance tasks specifically targeted at relevant failure modes. This way, every routine task is a justifiable use of time and resources. Your Maintenance Strategy should be the foundation of your entire maintenance process, with all routine maintenance tasks flowing from it.

To start, let’s briefly explain Figure 1:
- Asset Registration – this is an essential pre-requisite; you cannot look after your assets effectively if you don’t know what they are. A comprehensive register of every maintainable item is required.
- Criticality Analysis – each asset is assessed and ranked according to its criticality, i.e. how significant are the consequences of failure? This has a big influence on the maintenance strategy, with more resources directed towards maintaining the most critical assets.
- Maintenance Strategy – A strategy is developed to address critical failure risks. From this strategy flows a steady stream of routine maintenance tasks, each of which is designed to control a specific risk.
- These routine tasks are planned, scheduled, and executed by the maintenance team.
- The maintenance team confirms that the work was done and records any significant findings during the close out phase; this data is used to generate reports for analysis.
- Vulnerability Analysis – reports are analyzed to determine if the strategy is working. Are all failure risks under control? Or are some assets vulnerable to failure? This feedback allows adjustments to be made to improve the strategy (i.e. changes in the scope or frequency of maintenance tasks).
- Corrective maintenance (in orange) must also be addressed by the maintenance team, alongside routine maintenance (i.e. it is also planned, scheduled, and executed via the same process).
In this article, I want to focus on two specific steps from Figure 1 that are essential for designing and improving an effective maintenance strategy: Criticality Analysis and Vulnerability Analysis.
The Essential Foundation – Criticality Analysis
A Reliability Engineer might be responsible for thousands of assets. It’s not possible to give them all your undivided attention, so you need to prioritize. Criticality Analysis is a method for ranking your assets based on importance – i.e. which ones are more critical than others. This assessment is based on the consequences of failure. If an asset fails, how much of a problem will it cause? How much production will be lost? Will anybody get hurt? Will we fall out of compliance with regulations or standards? Each of these questions and their range of possible responses is given a value, which is weighted according to the context of the business and the operating conditions. These values are then summed to give an overall criticality score for each asset.
-1-1.jpg?width=1610&height=1074&name=5eab1fed33bf786590e89a56_AdobeStock_267331579_2_20%20(1)-1-1.jpg)
Once you have determined which assets are the most important, you can use this information to influence the design of your Maintenance Strategy. More resources can be allocated to those assets with higher criticality, and those with low criticality can be justifiably ignored.
Essential Feedback – Vulnerability Analysis
How do you know if your strategy is working? It’s not enough to just set an initial plan and hope for the best, because you won’t always get it right first time. You need to continuously monitor the results and make adjustments where necessary to generate improvement. This is where we can apply the feedback loop from Figure 1. After tasks from your strategy are executed and closed out, data is collected and analyzed to understand the effectiveness of the strategy.
But exactly what kind of data do we need to determine if the strategy is effective? To answer this question, think about what the strategy is trying to prevent – i.e. asset failure. This means that we need to know which assets are vulnerable to failure. What is their current health? If the strategy is working, then they will be running smoothly without defects. If the strategy is wrong, then there should be some warning signs that the asset is more likely to experience a failure. By monitoring these warning signs, or vulnerability, we get an indication of how effective the strategy is. Vulnerability can be determined by a combination of several different factors, such as failure rate, routine maintenance compliance, a sufficient stock of essential critical spares etc. As with criticality, each of these factors can be given a weighted numerical value, which can be summed to give an overall vulnerability score for each asset.
Using Overall Asset Risk to Enable Effective Decision-Making
If we consider that criticality is a measure of the consequences of failure, and vulnerability is a measure of the likelihood of failure, then it follows naturally that multiplying these values together will give a measure of risk. If you plot these two parameters on a graph, like in Figure 2 below, you get a good picture of overall Asset Risk, where Risk = Criticality x Vulnerability.
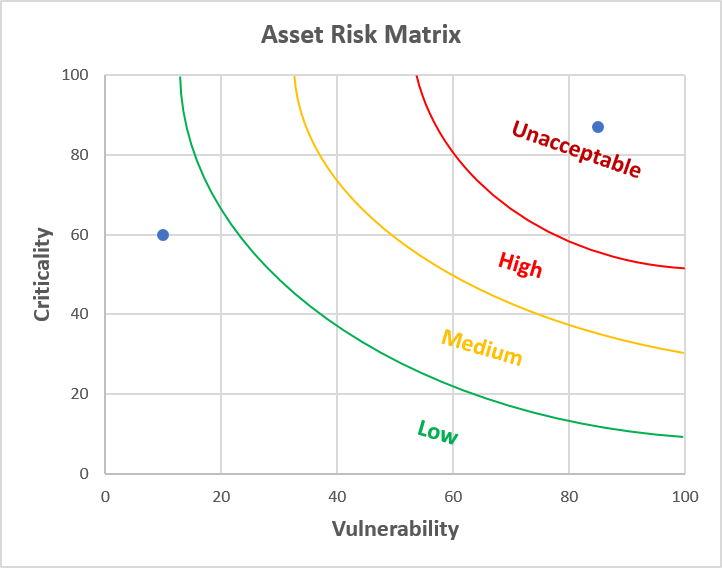
What we can achieve from this chart is a clear picture of assets that are both critical and vulnerable – i.e. those which are close to failure, and yet also have a high consequence of failure (i.e. the top-right section of Figure 2). Such visibility is extremely useful, as you can instantly see where your highest risks are, allowing action to be taken to adjust your strategy (e.g. increase maintenance scope or frequency), to bring such risks back under control.
Achieving Visibility in Practice
This level of visibility of asset risk is extremely useful, but it is difficult to achieve in practice. Calculating criticality and vulnerability would be easy if you only had to look after one asset – but with thousands, how do you keep track? Consider also that vulnerability is especially difficult to pin down, because it is constantly changing. From one day to the next, an asset’s current health will change, as maintenance is carried out and defects accumulate etc. Getting a live overview of asset risk, across a large asset portfolio, is nearly impossible.
Or at least, it was. Much of my time at Prometheus Group has been spent working with our development team to create a new software solution called Total Asset Optimizer (TAO), which is designed specifically to solve this problem. It provides Criticality Analysis, Vulnerability Analysis, and visualizes overall Asset Risk, directly inside of SAP:
- TAO provides you with a new interface for calculating criticality at the asset level, utilizing your existing Functional Location and Equipment structure. The calculation is based on factors such as asset function, production loss upon failure, and the level of built in redundancy. TAO calculates a Criticality score based on these factors (and more), giving you an objective way to assess and rank your assets according to criticality.
- Determining asset vulnerability is where TAO really shines. As I said earlier, vulnerability changes on a daily basis depending on current asset health, and is therefore difficult to track. TAO is able to solve this problem by utilising your live SAP data to make the calculation in real time. Are all routine maintenance tasks for this asset being executed on time? Are all critical spares in stock? Do we have any open defects against this asset? If a maintenance plan goes overdue, or if critical spares are consumed and not replenished – TAO will know about it, and will automatically increase the asset’s vulnerability score.
- Finally, TAO utilises your criticality and vulnerability scores to automatically calculate Overall Asset Risk for each piece of equipment. It includes a Risk Ranking Report, which allows you to pull in a selection of assets and rank them according to risk, so that your most urgent problems are highly visible. From this report, you can drill into each asset to instantly understand what is causing any vulnerabilities, so that they can be quickly addressed. This valuable information allows you to make effective decisions to continuously improve your maintenance strategy.
Conclusion
In managing your maintenance processes, don’t overlook the vital role that your Maintenance Strategy plays in making sure that your planners, schedulers, and technicians are focusing their attention in the right places. Developing and improving an effective Maintenance Strategy requires good visibility of criticality, vulnerability, and risk, across your entire asset portfolio. Previously, this was difficult to achieve in practice. But with Total Asset Optimizer, it is now possible to have all of the right information available in real time, in a highly visible format, so that effective decisions can be made.
I want to learn more about Prometheus Total Asset Optimizer!
Last Updated: May 22, 2025
