
To remain competitive, asset-intensive organizations are looking to its’ teams to provide more sophisticated, granular, and accessible data that can be easily captured and measured. A team may have the right tools or software to track data, but most organizations still struggle with knowing how, and which kind of data, is needed to provide an accurate view of plant or facility productivity and efficiency.
Some plants might be tracking the number of break-ins/break outs, but not break-in/break out hours, which can impact the scheduling of other work throughout the week or month.
The best place to start is by understanding what kinds of key performance indicators (KPIs) are needed to track the success or failure of a plan and schedule. Which ones are you currently tracking and is it helping you determine the performance of your schedule?
From my years of experience in the industry, I’ve learned there are nine key metrics that every organization should be tracking within Maximo and integrating into their planning and scheduling processes. Capturing these nine metrics are the foundation for analyzing the effectiveness of your planning and scheduling process and will allow your organization to evolve into even greater data for analysis in the future.
9 KPI Metrics for Maximo Scheduling
1. Gross Versus Net Available Hours
This is one of the most important sets of metrics to capture and understand. How well you understand these metrics and how you integrate them into your planning and scheduling process will have a dramatic effect on the effectiveness of your planning and scheduling efforts.
Many organizations schedule their next week’s work based on gross available hours; if 10 technicians work eight hours per day, the scheduler will plan out 80 hours’ worth of work.
Here’s the problem with this approach: it fails to consider variables that can take away from your worker’s availability, such as sick leave, vacation, training days, etc.
The hours your workers are available after taking these exceptions into account gives you your net available hours. If you’re scheduling against the gross available hours, you will always be scheduling over capacity because you don’t have a grasp of how many hours are truly available.
Net Available Hours is also used to calculate additional metrics, a few of which I’ll discuss later in this article.
2. Number of Break-ins / Break-outs
At the end of a work week, you should already have planned and scheduled work for the following week. However, schedulers can’t predict the future, so it is likely that unplanned events will come up that interfere with scheduled work.
Since it is likely that some of your planned work will have to be rescheduled because of these “break-ins,” it is best practice not to schedule upcoming weeks to capacity with high priority work only. Schedule some lower-priority tasks that won’t interfere with your plant’s operations if they have to be rescheduled. The number of break ins/break outs that occur each week is unique to each organization.
By tracking the average amount that occurs in your plant, your planners and schedulers will know how much “wiggle room” they should leave when creating the schedule. Tracking and applying this metric will affect how your organization is able to adapt to unpanned circumstances going forward.
3. Break-in Hours / Break-out Hours
Although tracking the number of break ins/break outs that occur in your organization week after week will give your planners and schedulers an edge, they will still be at a disadvantage if they don’t know how long those break-ins will take.
If you schedule 10 lower-priority tasks that take a total of 20 hours but have to reschedule them for a break in that will take 40 hours, you’re running behind. Therefore, you shouldn’t just track the number of break-ins that occur in your plant, but also the hours that they will take out of your schedule when they happen.
Looking at historical trends regarding how many break-in hours typically happen within a given week, can help to ensure your scheduling an adequate number of lower-priority tasks.
You can view the Prometheus Analytics Dashboard below which includes data around the number of break-ins and break-outs within a given week.
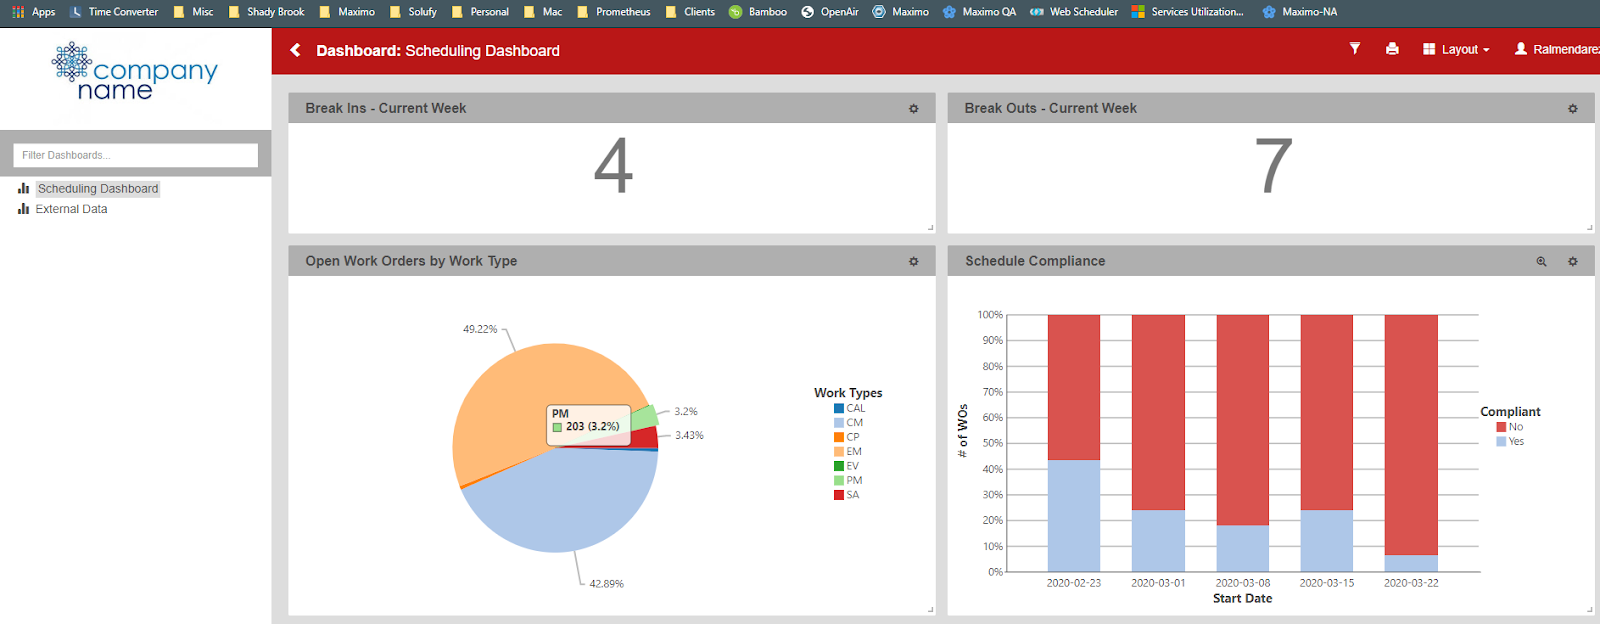
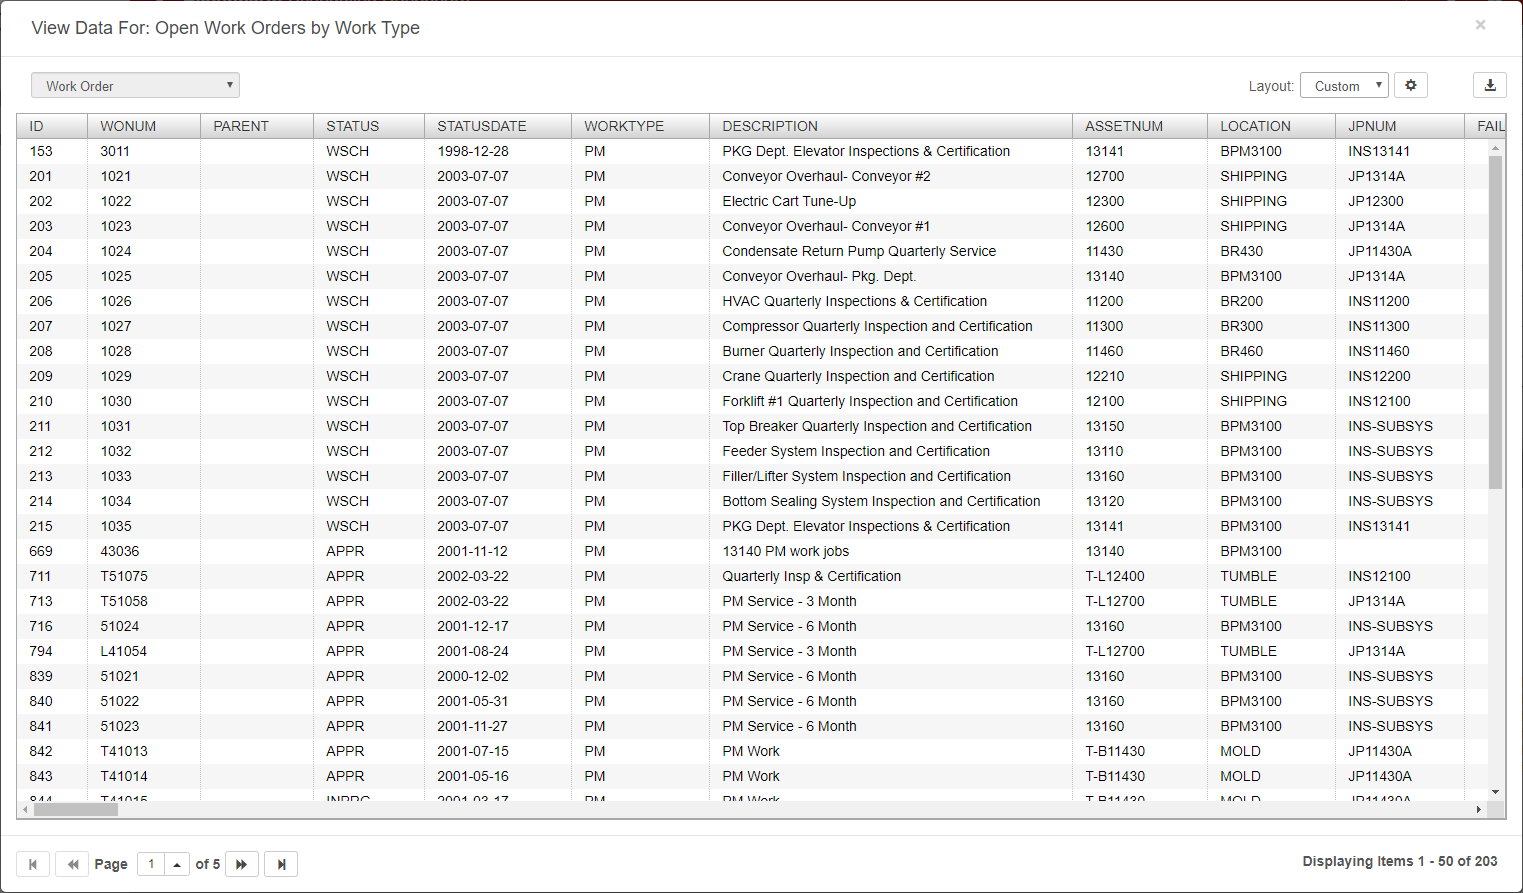
Clicking on a data point will open a Data View dialog which shows the data that makes up that metric. The image below (Figure 2) was a result of clicking on the “Open Work Orders by Work Type” -> PM slice of the pie chart on the chart above (Figure 1).
4. Schedule Compliance
Schedule compliance is simple to calculate: if you scheduled 100 work orders but only 85 got done, you would have 85% schedule compliance. The next step would be to discover what caused those remaining 15 work orders to be incomplete.
This metric helps you track the overall health and efficiency of your planning/scheduling process. If schedule compliance is consistently low across several weeks, that should throw up a red flag that some problem needs to be corrected or additional analysis should occur.
KEY TIP: Ensure that you’re capturing a baseline before your work week begins. This will ensure that you have a snapshot of what was scheduled in order to measure against the work as it begins getting executed and completed. For example, your schedule compliance percentage will be rendered useless if workers can easily change the dates on late work orders. That’s why it’s important to put measures in place to prevent this, such as the Prometheus Web Scheduler for Maximo, which capture baselines externally and are unable to be modified by the end-user.
5. PM Compliance
Preventative maintenance (PM) is vital to the long-term effectiveness of your assets and your organization as a whole. Therefore, it is important to do preventative maintenance well and apply it to the unique needs of your organization. Each organization (or even each plant) should understand their assets’ specific needs and how often they should be serviced.
Here’s how this applies in practice: Let’s say your asset needs to be serviced every three months, or four times per year. This service may generate a "Start No Earlier Than" and "Finish No Later Than" date on the Work Order of +/- 15 days; therefore, there are 30 days available to complete the PM Work Order and remain in compliance.
PM Compliance is typically measured by month and will identify how many PMs were completed within their allotted time versus the quantity of PM Work Orders generated. PM Work Orders not completed at all, is also something that should also be tracked. If your asset is not receiving the service it needs within the necessary time frame, it will be more likely to break down in the future.
It is important to track all aspects of your PM compliance in order to avoid equipment breakdowns that will cause more negative downstream effects in the future.
6. Scheduled PM Compliance
Scheduled PM compliance is important to track alongside standard PM compliance. Here’s the difference: If 100 work orders were scheduled and 80 were PM work orders (they were generated from PMs), then the amount of PM compliance is determined by how many PMs I completed, divided by how many were available. This is the same way that scheduled compliance is calculated. It is the amount of work orders completed compared against how many were scheduled at the time.
Many organizations want to answer the question, what is my PM to CM (corrective maintenance) ratio? A lower ratio indicates that your PM processes are doing their job and preventing unforeseen equipment failure from occurring. A high ratio means that you are being more reactive rather than proactive. This should indicate that something about your processes needs to change.
Therefore, tracking your PM schedule compliance is vitally important to the health of your organization. If you have a consistently low schedule compliance (and by extension, scheduled PM compliance) rate, over time you will have more frequent CM work orders since you’re not consistently completing work orders in the time you should.
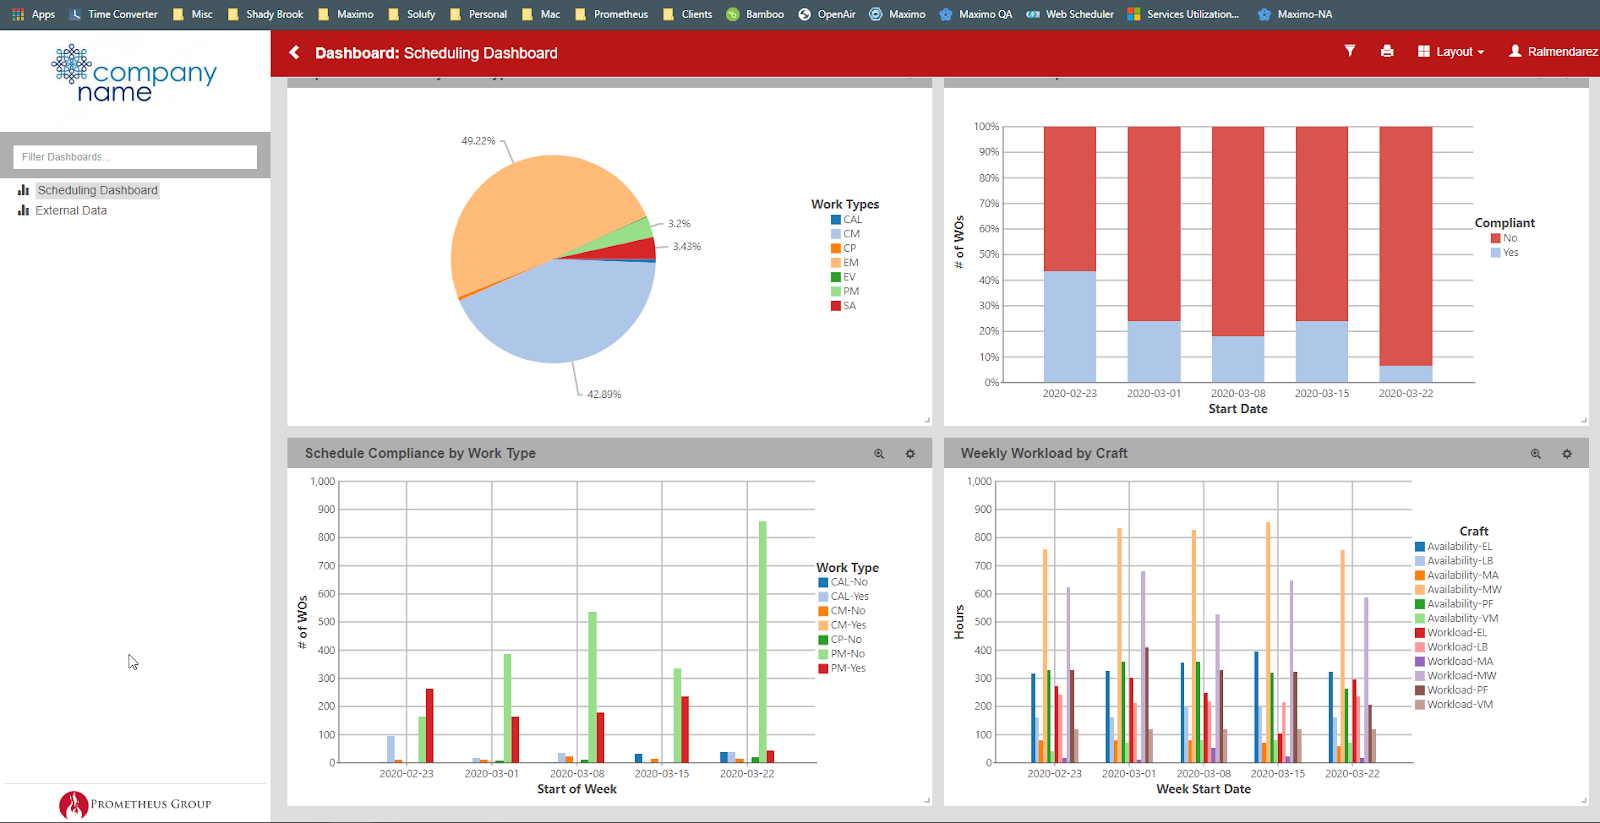
As you can see in the dashboard below (Figure 3), Analytics provides a breakdown of many scheduling compliance KPIs listed earlier in this article.
7. Backlog WOs & Backlog Hours
Your “backlog” consists of work that is not scheduled but needs to get done in the future. It is important to have a backlog so that work is not forgotten, and workers can be assigned those tasks if they have time after their scheduled tasks are complete or when there are periods of time when less “normal” scheduled work is available.
However, if your backlog contains “too much” work and is constantly growing, then your scheduling process may need a review and/or additional staff may be needed.
For this reason, it is important to also track how many hours it will take to complete the work in your backlog, or your backlog hours. Similar to break-in hours, the time it will take to complete the work is a better indicator than the quantity of work itself. Learn how Dean-Fluor Reduced time-to-schedule by 20-25 hours per week by reading the Dean-Fluor Case Study.
8. Total Actual Hours
This metric is closely related to your net available hours. You can determine your total actual hours by monitoring how many of your scheduled hours are actually being used to complete work. This is an important indicator for determining the efficiency of your processes. Ask the question, how many actual hours are getting reported back into the system?
For example, if you schedule 380 hours and achieve 100% schedule compliance, but only 320 of those hours were used, where did those other 60 scheduled hours go? This is an indicator that you have too much time allocated to this work and you’re not making the most efficient use of your resources.
9. Total Actual OT Hours
On the other hand, reviewing the Total OT Hours performed for a week is important to understand if the work performed per the schedule truly requires more hours than what was anticipated. This is very similar to comparing scheduled work hours to actual work hours, but OT hours typically cost the organization much more (time and a 1/2, double time, etc..).
However, this is not a true 1:1 comparison, as OT hours are not always scheduled. Scheduling OT hours should be the exception, not the norm. Common reasons for scheduling OT could include things like completing work before regulatory due dates, major projects where the completion of that project has benefits that outweigh the cost of OT, environmental or safety work, major emergency repairs, etc.
Integrating These Metrics Together
No single metric paints the whole planning and scheduling picture. 100% schedule compliance means nothing if your total actual hours are dramatically short of your net available hours, or if your total actual OT hours are burning through your maintenance budget on low priority tasks.
The ability to see all these metrics together will enable your planners and schedulers to create efficient processes to ensure that your organization is optimizing the use of all its resources.
Prometheus Planning and Scheduling for Maximo is dynamic and robust enough to capture these metrics and more. The data is stored in Maximo and the Prometheus Web Scheduler. The platform’s Analytics solution collects, analyzes, and creates visual representations of all tracked data in an easy-to-view interface. If your plant or facility is looking for a configurable, integrated analytics and planning and scheduling solution, contact us today!